
Someone facing a stack of papers on one topic first wants to know which genes, drugs, diseases and cell types they keep mentioning together. Empirica turns biomedical PDFs into a knowledge graph that shows it. A scispaCy model [1] finds the entities, any two entities that share a sentence get an edge, NetworkX finds communities and bridge nodes, and the result is drawn as an interactive 2D or 3D force-directed graph [2], with a Claude-backed chat and hypothesis generator on top. Three of us built it in about 31 hours at a weekend hackathon.
On three open-access papers the graphs were small, 20 to 37 nodes, and nearly every edge came from plain co-occurrence: 44 to 190 per paper, against 1 to 14 from verb patterns. The scispaCy pass took 7.2 to 12.8 seconds per paper and everything after it under a quarter of a second, so the model is the pipeline.
Why It Matters
The idea was a reading aid. Instead of skimming forty abstracts, you upload the PDFs and get a map of which entities the papers talk about together, which clusters they form, and which entities sit between clusters, with the sentences behind every edge and a chat box for questions.
The scope was broad for a weekend: several PDFs per project, each with its own graph that can be switched on and off; biomedical entity extraction; communities and centrality so the graph says something beyond a hairball; an LLM chat and hypothesis generator; an agent that finds more papers; and Google sign-in with a project list per user.
Jalen Francis built most of it, including the NLP and graph pipeline, the retrieval layer, the LLM service, the agentic module and most of the frontend. Edward Kim wrote the first Google OAuth pass. I built the login screen and branding and the backend's health-check and auth-check endpoints.
Technical Details
Entities Are the Easy Part, Relations Are the Hard Part
Biomedical named entity recognition is a mature task. Empirica uses en_ner_bionlp13cg_md, one of the scispaCy models [1], trained on the BioNLP 2013 Cancer Genetics corpus [3], which labels things like genes or gene products, chemicals, cancers, cell types and organisms. Given a sentence, it returns character spans and labels.
Relations are harder, because saying how two entities are related means reading the sentence. Empirica does the cheapest thing and keeps the sentence so a human can judge.
Co-occurrence as an Edge
If two entities appear in the same sentence, draw an edge between them and count how many sentences they share. That is the oldest trick in literature mining, and Swanson's early literature-based discovery work leaned on it at the level of whole articles [4]. It has high recall and low precision: two entities can share a sentence because one causes the other, because they were measured in the same assay, or because they sit in the same list, and the edge cannot tell which. What it does well is stay auditable. Keep the sentence, and every edge can be checked.
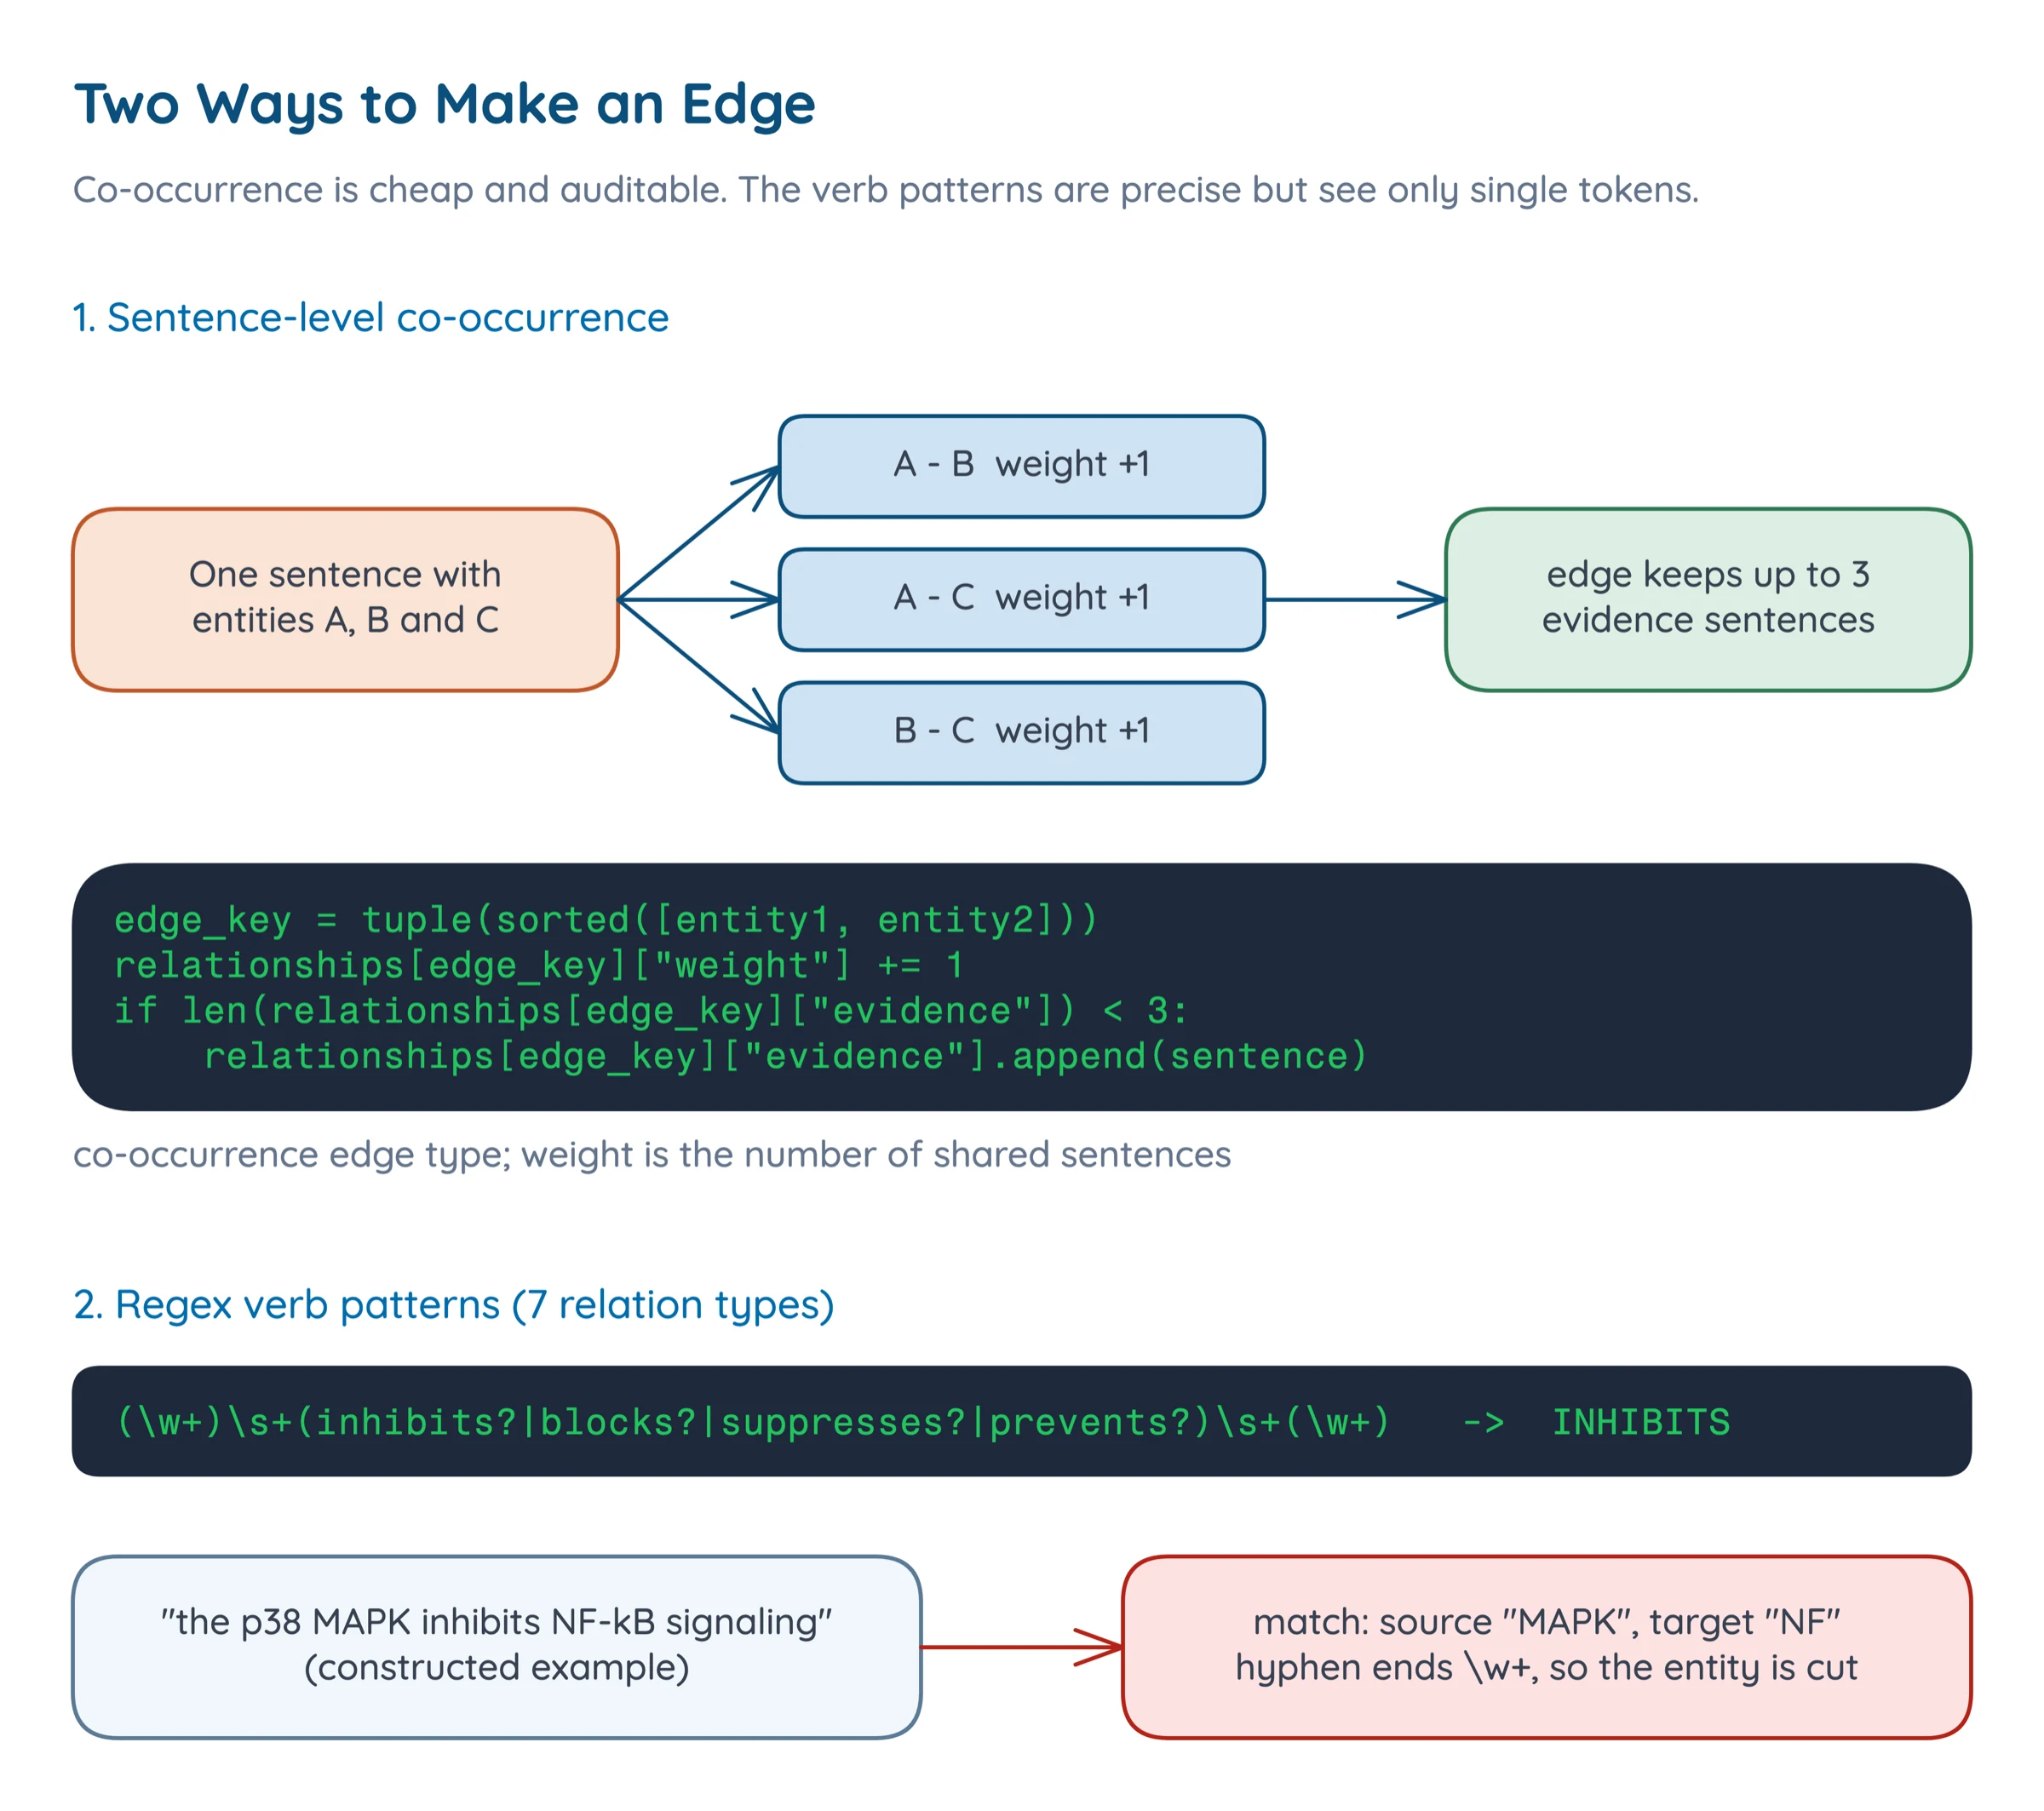
Empirica makes edges two ways. The co-occurrence extractor pairs up the entities in each sentence and keys an edge on the sorted pair, so A to B and B to A are the same edge. Weight is the number of shared sentences, and each edge stores up to three of them as evidence. The second extractor runs seven regex patterns (CAUSES, CAUSED_BY, INHIBITS, INHIBITED_BY, INTERACTS_WITH, TREATS, REGULATES) of the form (\w+)\s+(inhibits?|blocks?|...)\s+(\w+) to give an edge a type and a direction. A match is kept if its source or target is in the sentence's entity dictionary.
Communities and Centrality
Two standard tools describe a weighted graph's structure. Louvain community detection [5] greedily merges nodes into groups that maximise modularity, which rewards groups with dense internal edges and sparse edges between them. Betweenness centrality [6] scores a node by the fraction of shortest paths between other nodes that pass through it, so it finds bridges rather than merely popular nodes. Both are one-line calls in NetworkX [7] and python-louvain.
Layout and Retrieval
A force-directed layout treats edges as springs and nodes as repelling charges and lets the system settle [2], so clusters appear as visual clumps without any coordinates from the data. The frontend uses react-force-graph for both the 2D and the 3D view.
Retrieval-augmented generation feeds an LLM passages fetched from a corpus alongside the question [8]. The usual retriever embeds query and passages and returns the nearest; Empirica already has a graph of entities, so its retriever keys on entities instead.
Architecture
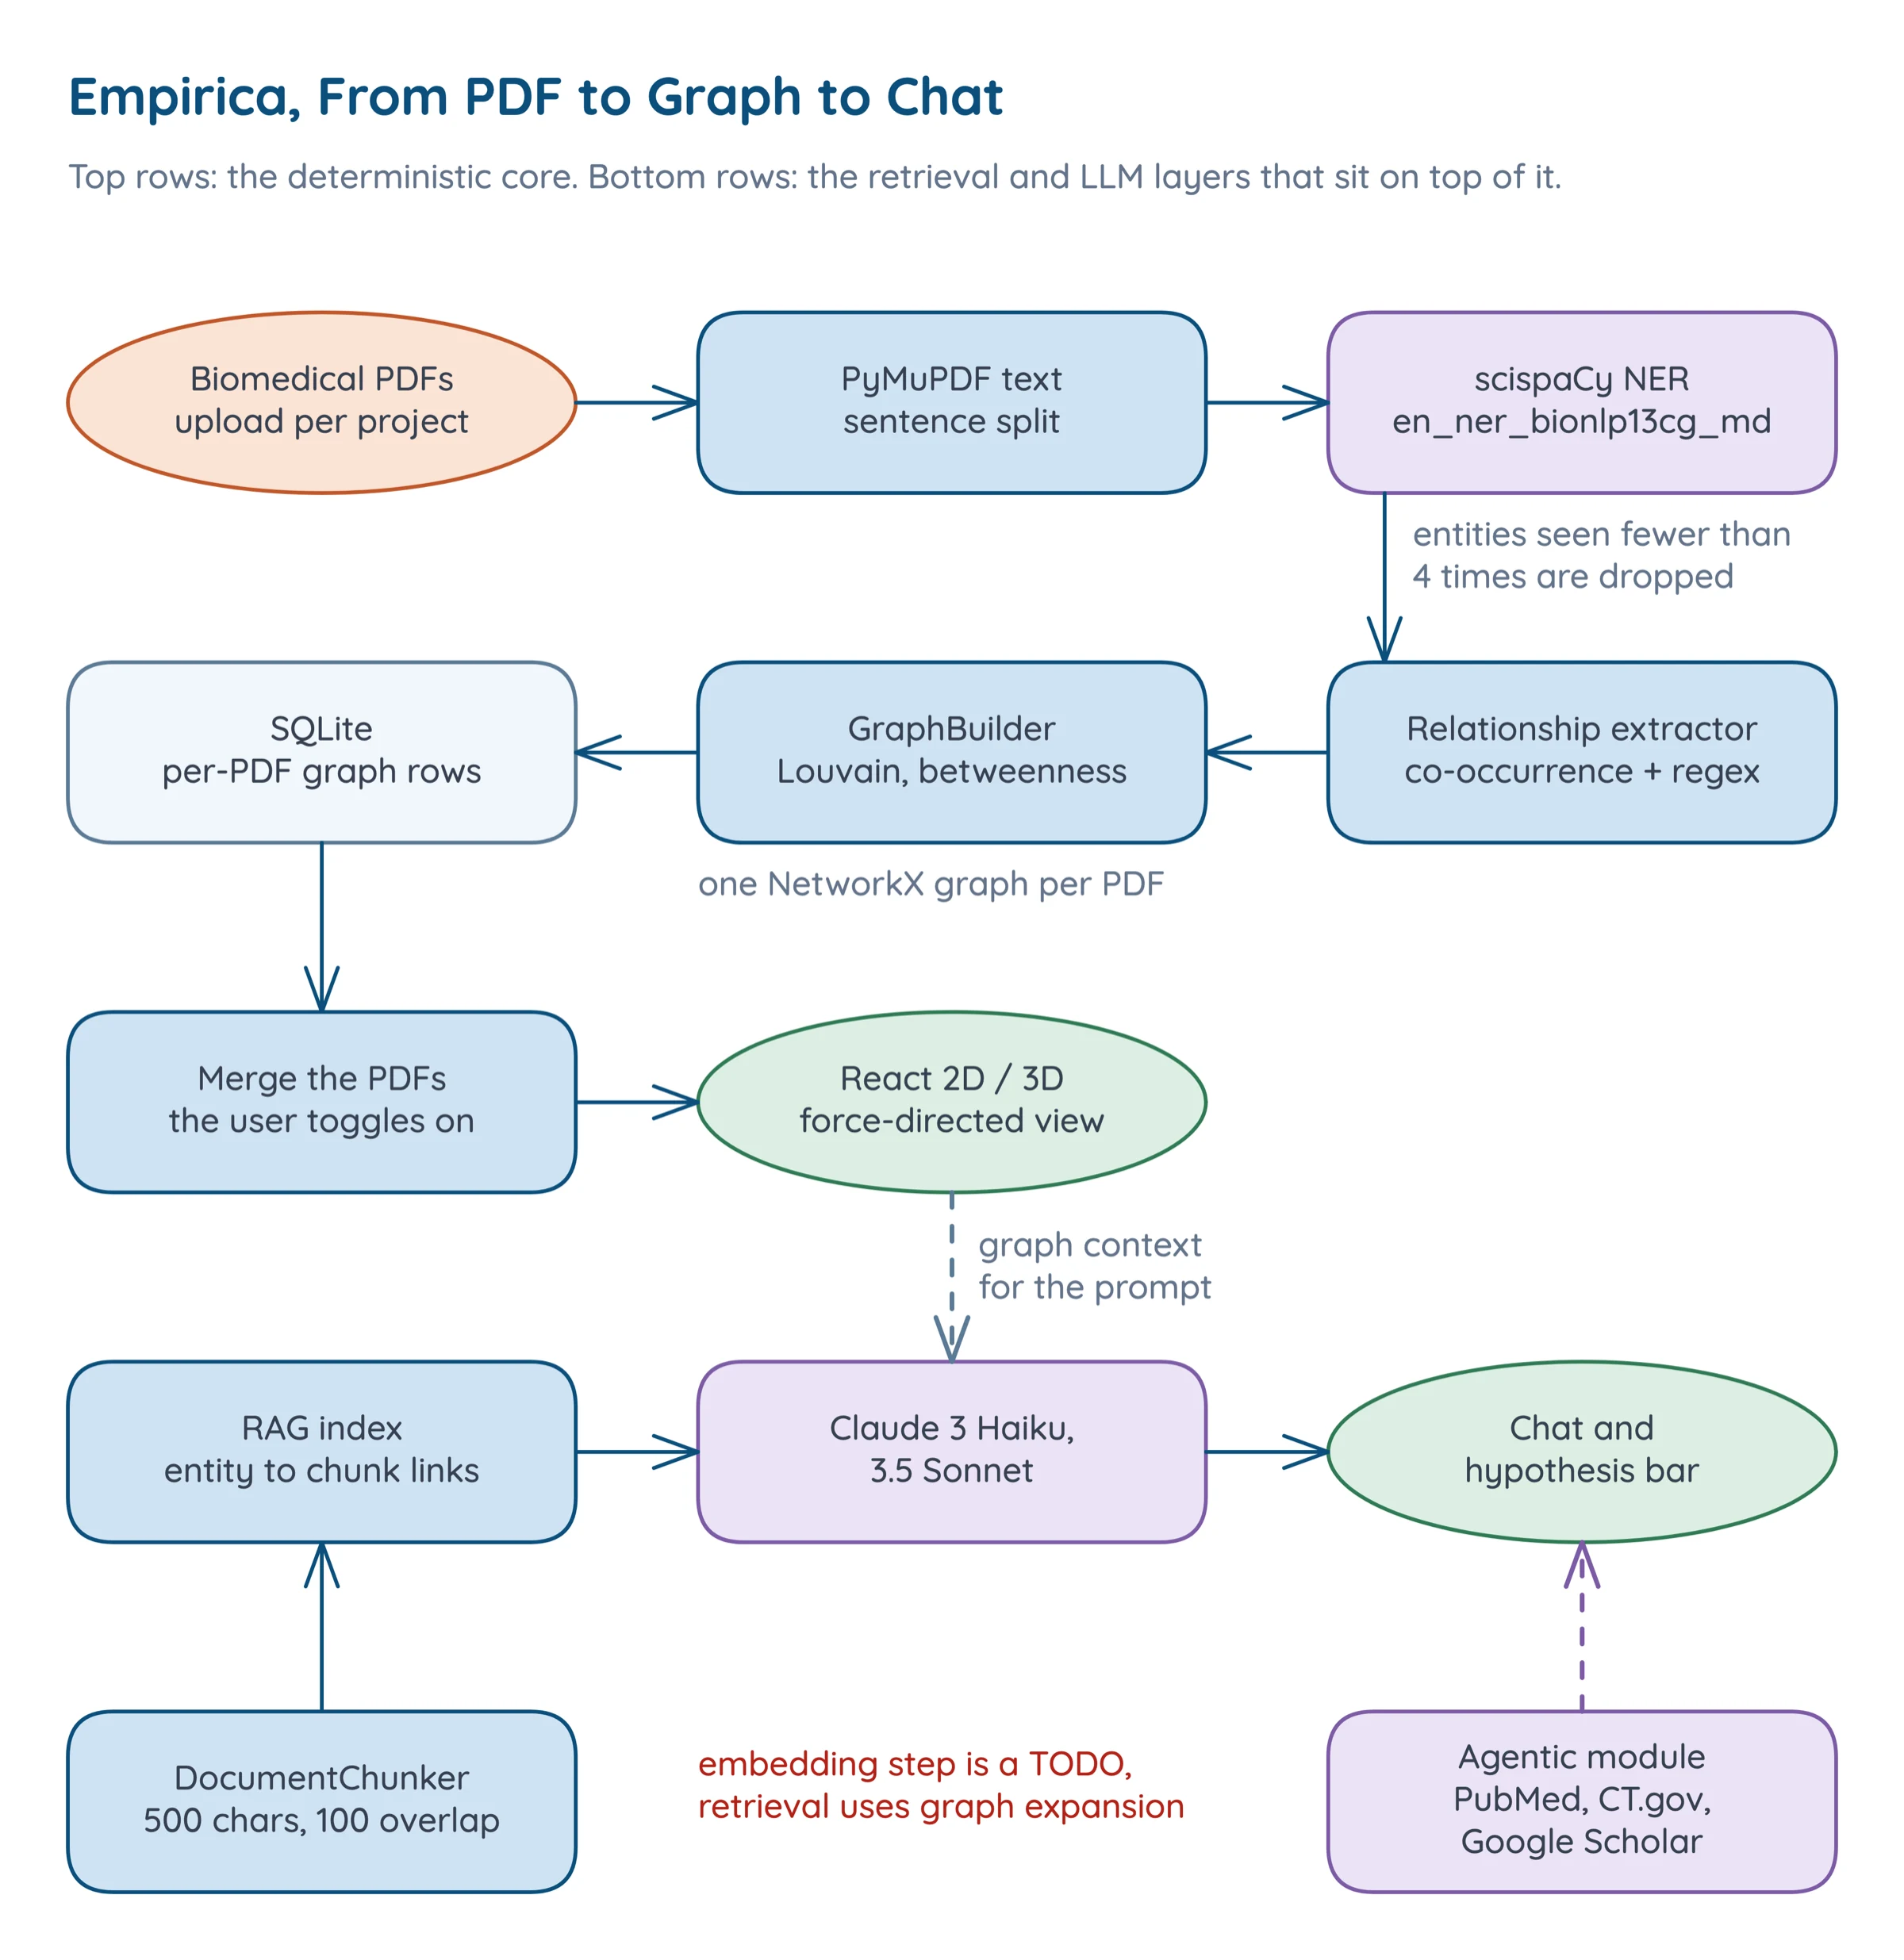
The backend is FastAPI with SQLAlchemy on SQLite, and the frontend is React 18 with TypeScript, Vite, Tailwind and Zustand. Google OAuth handles sign-in. A user creates a project and uploads PDFs to it, and each PDF is processed independently into its own graph.
The bottom row is the layer on top. DocumentChunker splits each PDF into overlapping chunks that record their page and entities, RAGService maps entities to chunk ids, the LLM layer talks to Claude 3 Haiku and Claude 3.5 Sonnet, and the agentic module drives PubMed, ClinicalTrials.gov and Google Scholar searches, feeding what it finds back through the same NER, relationship and graph code.
Implementation
Extracting Entities, and Throwing Most of Them Away
PyMuPDF extracts each PDF's text, the project's PDF processor splits it into sentences, and each sentence goes through the scispaCy model. Jalen's NERService maps the model's fine-grained labels onto a smaller set of app types, drops entries that look like journal names or affiliations with a list of regex exclusions, and then applies the filter that shapes everything downstream: an entity has to appear in at least four sentences.
self.min_entity_occurrences = 4 |
Counts are per sentence, so an entity repeated within one sentence counts once.
Merging the Two Kinds of Edge
When a pattern hits a pair that co-occurrence already found, the merge keeps the co-occurrence weight, adds 2.0, appends the evidence, and overwrites the edge type with the semantic one.
if edge_key in merged: |
GraphBuilder then loads the merged edges into a NetworkX graph, dropping any edge whose endpoints are not among the kept entities, calls community_louvain.best_partition, and computes betweenness centrality, returning the top 20 nodes.
An Entity-Indexed Retriever
RAGService.index_document stores the chunks and, for each chunk, appends its id to a dictionary from entity name to chunk ids. Retrieval takes the entities found in the user's question, scores each chunk by how many of them it mentions, and takes the top few. If the graph is loaded, it also adds up to five graph neighbours of each entity and attaches up to three of their edges with evidence sentences. That is entity-indexed chunk lookup plus one hop of graph expansion, a reasonable design for a graph-first app.
Sign-in and Health Checks
My part sat at the edges of the system. I rewrote and extended Edward's login component into the login screen and did the branding. On the backend I added the CORS configuration and three small endpoints, /api/health, /api/test-auth, and /api/projects-test, which lists the signed-in user's projects.
|
The health endpoint shows a deployed backend is up at all, and the auth check shows whether a Google token resolves to an account.
Problems
1. The Raw Entity List Is Noisy
The raw scispaCy output is noisy, down to journal names and affiliations, which is why NERService maps labels, applies regex exclusions and keeps only entities seen in at least four sentences. The frequency filter is what makes the graph readable. On the first paper below, 501 sentences contained an entity before the filter and 429 after, and only 37 distinct entities survived in a 648-sentence paper. The price is that the graph summarises the frequent entities only: a rare but important gene never appears.
2. A Shared Sentence Does Not Say How Two Entities Relate
A co-occurrence edge between a drug and a gene might be an inhibition or just a shared list. Every edge carries up to three evidence sentences, so a reader can judge any edge in the app. The verb patterns add typed, directed relations on top, and the merge gives a pattern-matched pair an extra 2.0 of weight and its semantic type.
3. Several Papers, One Graph
A researcher wants to see a project's PDFs together, apart, or with one left out. Each PDF's nodes and edges live in pdf_graph_nodes and pdf_graph_edges, keyed by document, and each Document has a selected flag (default 1). The merged-graph route merges the selected documents on request and records their filenames in the response metadata. Unticking a PDF removes its contribution without reprocessing anything, and provenance is preserved because every node and edge still belongs to one document. The cost is that merging happens at request time and identical entity names are the only merge key.
Experiments
The experiment takes three CC BY papers and runs each through the project's PDFProcessor, NERService, RelationshipExtractor and GraphBuilder unchanged, timing each stage on an Apple silicon Mac's CPU. There are no LLM calls. The papers are a JNK and cisplatin review (PMC13028654), a study of MK2, p38 and p53 in macrophages (PMC13072840), and a SNORA64 and apoptosis paper (PMC13090758). The last one has no license tag in its XML, though Europe PMC's metadata lists it as CC BY.
Each input is the paper's full-text XML from Europe PMC [9], written into a plain-text PDF with PyMuPDF. That gives a single column with no headers or footnotes, which probably makes sentence splitting cleaner than on a real two-column PDF. Each paper was run once, and with no ground truth these numbers say how the pipeline behaves, not whether an edge is correct.
Results
The Graphs Are Small and Uneven
The 648-sentence JNK review produced 37 nodes and 113 edges in 7 communities, the largest with 13 nodes. The MK2 paper, at 407 sentences, gave 27 nodes and 115 edges in 4 communities, with a density of 0.328, the highest of the three. The SNORA64 paper gave 20 nodes, 23 edges and 10 communities with the largest at 5, an average degree of 2.3. Graph size does not follow paper length; it follows how repetitive a paper is about a handful of entities.
In the first two papers the top betweenness node is the generic word "cells" (0.226 and 0.248), with "A549 cells" (0.199) and "cancer" (0.128) next in the first. In the third it is the paper's own subject, SNORA64 (0.231), followed by BCL-XL (0.097). Centrality found the topic in one paper and a generic noun in two. The entity filter drops rare entities but not uninformative frequent ones.
Co-occurrence Does the Work
The first paper had 190 co-occurrence edges and 14 pattern edges, the second 143 and 10, the third 44 and 1. After merging, 188 of the first paper's 200 edges are still typed CO_OCCURRENCE. The typed relations are a thin layer over an undirected association graph. Before believing any typed edge in the app I would read its evidence sentences, which is what the three-sentence evidence store is for.
The graphs have fewer edges than the merged extractors produced (113 against 200, 115 against 151, 23 against 45), because GraphBuilder drops any edge whose endpoints are not among the kept entities.
The Model Is the Pipeline
NER took 12.79, 7.39 and 7.17 seconds. Text extraction and sentence splitting took 0.06 to 0.12 seconds, and everything else (entity filter, relationships, graph, Louvain, betweenness) took 0.03 to 0.09 seconds. On graphs this small the analytics are free, so a corpus of a hundred papers costs about what a hundred NER passes cost.
What I Would Change
Evaluate Edges Against Something
I would hand-label 50 co-occurrence edges and 50 pattern edges from the three graphs by reading their evidence. Precision for each extractor would tell me whether the typed edges are worth their weight, and whether count-weighted co-occurrence is better than a single shared sentence.
Handle Generic Entities
Generic terms such as "cells" and "cancer" dominate betweenness in two of three papers. A stoplist, or downweighting entities that appear across many papers, would leave the graph closer to what a reader wants.
References
- Mark Neumann, Daniel King, Iz Beltagy, Waleed Ammar. ScispaCy: Fast and Robust Models for Biomedical Natural Language Processing. Proceedings of the 18th BioNLP Workshop and Shared Task, ACL, 2019. link
- Thomas M. J. Fruchterman, Edward M. Reingold. Graph drawing by force-directed placement. Software: Practice and Experience 21(11), 1991. doi:10.1002/spe.4380211102
- Sampo Pyysalo, Tomoko Ohta, Makoto Miwa et al. Overview of the Cancer Genetics (CG) task of BioNLP Shared Task 2013. Proceedings of the BioNLP Shared Task 2013 Workshop, ACL, 2013. link
- Don R. Swanson. Fish oil, Raynaud's syndrome, and undiscovered public knowledge. Perspectives in Biology and Medicine 30(1), 1986. doi:10.1353/pbm.1986.0087
- Vincent D. Blondel, Jean-Loup Guillaume, Renaud Lambiotte, Etienne Lefebvre. Fast unfolding of communities in large networks. Journal of Statistical Mechanics: Theory and Experiment, 2008. doi:10.1088/1742-5468/2008/10/P10008
- Linton C. Freeman. A set of measures of centrality based on betweenness. Sociometry 40(1), 1977. doi:10.2307/3033543
- Aric A. Hagberg, Daniel A. Schult, Pieter J. Swart. Exploring network structure, dynamics, and function using NetworkX. Proceedings of the 7th Python in Science Conference (SciPy), 2008. link
- Patrick Lewis, Ethan Perez, Aleksandra Piktus et al. Retrieval-Augmented Generation for Knowledge-Intensive NLP Tasks. Advances in Neural Information Processing Systems (NeurIPS), 2020. link
- Europe PMC. Europe PMC RESTful Web Service (full-text XML endpoint). Europe PMC documentation. link